Last Updated: November 28, 2025 Draft Stage: 3rd Draft
Avalanche Differential Specification and Protocol Architecture
This specification provides the mathematical framework for Avalanche’s economic dynamics. For conceptual foundations, see Systems Engineering Perspective. For subsystem state variables and parameters, see Subsystem Analysis. Current network metrics are sourced from the Data Snapshot.
1. Overview
This differential specification characterizes how the Avalanche economic system evolves over time, providing a mathematical framework for understanding system dynamics that may be governable, environmental, relational, or mechanistic. The specification builds upon the Avalanche Economic Network exploratory analysis developed in previous milestones and seeks to formalize the state dynamics and feedback loops inherent in the Avalanche network.
The Avalanche network represents a complex adaptive dynamical system where technical and economic components influence each other continuously. This creates distinct economic challenges and opportunities that require sophisticated control-theoretic understanding to navigate effectively. This specification provides formal and analytic contexts through which to analyze the unique architecture of the AVAX Token, the Primary Network, and application-specific Layer 1 blockchains (L1s).
Building on the foundational economic concepts (Milestone 1) and systems engineering perspective (Milestone 2), this differential specification provides a rigorous mathematical framework consisting of coupled differential equations that model the dynamic interactions between token supply, staking behavior, fee markets, and the L1 ecosystem. The specification transforms qualitative understanding into mathematical relationships, enabling systematic analysis of how financial and governance interfaces can impact network behavior.
2. Mathematical Framework
This section provides comprehensive reference tables for all variables, equations, and parameters used throughout the specification.
2.1 State Variables
| Variable | Units | Subsystem | Description |
|---|---|---|---|
| total_staked | AVAX | Staking | Total AVAX locked in staking |
| validator_staked | AVAX | Staking | AVAX staked directly by validators |
| delegator_staked | AVAX | Staking | AVAX delegated to validators |
| staking_apr | % | Staking | Current annualized staking return |
| validator_count | Integer | Staking | Number of active validators |
| total_supply | AVAX | Token Supply | Total minted AVAX (approaches MAX_SUPPLY) |
| circulating_supply | AVAX | Token Supply | Liquid AVAX available for transactions |
| locked_supply | AVAX | Token Supply | AVAX locked in vesting or contracts |
| cumulative_burned | AVAX | Token Supply | Total AVAX permanently destroyed |
| issuance_rate | AVAX/day | Token Supply | Rate of new AVAX creation |
| gas_price | nAVAX | Fee Dynamics | Current price per unit gas |
| excess_gas | gas | Fee Dynamics | Accumulated gas above target (drives price) |
| gas_consumed | gas/s | Fee Dynamics | Current network gas consumption rate |
| fee_burn_rate | AVAX/day | Fee Dynamics | Rate of fee burning on Primary Network |
| network_utilization | % | Fee Dynamics | gas_consumed / TARGET_GAS_RATE |
| l1_count | Integer | L1 Ecosystem | Number of active L1 blockchains |
| l1_validator_count | Integer | L1 Ecosystem | Total validators across all L1s |
| l1_fee_burn_rate | AVAX/day | L1 Ecosystem | Rate of L1 fee burning |
| proposed_acp_count | Integer | Governance | ACPs in proposed stage |
| implementable_acp_count | Integer | Governance | ACPs ready for implementation |
| activated_acp_count | Integer | Governance | ACPs successfully activated |
| stale_acp_count | Integer | Governance | ACPs that became inactive |
For detailed subsystem decomposition, see the Subsystem Analysis.
2.2 Dynamic Functions
Staking Functions
| Function | Description | Specification |
|---|---|---|
| staking_inflow() | Rate of new AVAX entering staking | See Section 4.1 |
| unstaking_outflow() | Rate of AVAX leaving staking | See Section 4.1 |
| validator_staking_inflow() | New validator stake deposits | Validator portion of staking_inflow() |
| validator_unstaking_outflow() | Validator stake withdrawals | Validator portion of unstaking_outflow() |
| delegator_staking_inflow() | New delegations | Delegator portion of staking_inflow() |
| delegator_unstaking_outflow() | Delegation withdrawals | Delegator portion of unstaking_outflow() |
| reward_distribution() | Total staking rewards per unit time | Protocol mechanism (Section 2.4) |
| validator_rewards() | Rewards to validators | reward_distribution() × validator_share |
| delegator_rewards() | Rewards to delegators | reward_distribution() × (1 - validator_share) × (1 - COMMISSION_RATE) |
For participant role analysis, see the Participant Roles Taxonomy.
Population Functions
| Function | Description | Specification |
|---|---|---|
| validator_entry_rate() | New validators joining | See Section 4.1 |
| validator_exit_rate() | Validators leaving | See Section 4.1 |
| l1_creation_rate() | New L1s deployed | See Section 4.4 |
| l1_abandonment_rate() | L1s discontinued | See Section 4.4 |
Supply Functions
| Function | Description | Specification |
|---|---|---|
| unlock_rate() | Vested tokens becoming liquid | Exogenous schedule |
| proposal_rate() | New ACPs submitted | Community activity |
| implementation_rate() | ACPs moving to activation | Governance process |
| stale_rate() | ACPs becoming inactive | Timeout mechanism |
2.3 Differential Equations
The following equations define how state variables evolve over time.
Staking Dynamics
| Variable | Law of Motion |
|---|---|
| total_staked | d(total_staked)/dt = staking_inflow() − unstaking_outflow() + AVG_RESTAKE_RATE × reward_distribution() |
| validator_staked | d(validator_staked)/dt = validator_staking_inflow() − validator_unstaking_outflow() + VALIDATOR_RESTAKE_RATE × validator_rewards() |
| delegator_staked | d(delegator_staked)/dt = delegator_staking_inflow() − delegator_unstaking_outflow() + DELEGATOR_RESTAKE_RATE × delegator_rewards() |
| validator_count | d(validator_count)/dt = validator_entry_rate() − validator_exit_rate() |
See the Staking Dynamics subsystem analysis for detailed state variable specifications.
Token Supply Dynamics
| Variable | Law of Motion |
|---|---|
| total_supply | d(total_supply)/dt = issuance_rate, subject to total_supply ≤ MAX_SUPPLY |
| circulating_supply | d(circulating_supply)/dt = issuance_rate − d(total_staked)/dt + unlock_rate() |
| cumulative_burned | d(cumulative_burned)/dt = fee_burn_rate + l1_fee_burn_rate |
| issuance_rate | issuance_rate = reward_distribution() |
The burn mechanism is analyzed in the Token Supply subsystem and Economic Taxonomy.
Fee Dynamics (ACP-103)
| Variable | Law of Motion |
|---|---|
| excess_gas | d(excess_gas)/dt = gas_consumed − TARGET_GAS_RATE |
| gas_price | gas_price = MIN_GAS_PRICE × exp(excess_gas / FEE_ADJUSTMENT_CONSTANT) |
| fee_burn_rate | fee_burn_rate = gas_price × gas_consumed |
| gas_consumed | gas_consumed = bytes × BANDWIDTH_WEIGHT + reads × READ_WEIGHT + writes × WRITE_WEIGHT + compute_us × COMPUTE_WEIGHT |
These equations implement ACP-103: Dynamic Fees. For context on the proposal, see our ACP Summaries.
L1 Ecosystem Dynamics (ACP-77)
| Variable | Law of Motion |
|---|---|
| l1_count | d(l1_count)/dt = l1_creation_rate() − l1_abandonment_rate() |
| l1_fee_burn_rate | l1_fee_burn_rate = l1_validator_fee() × l1_validator_count |
| l1_validator_fee() | L1_BASE_FEE_RATE × exp(max(0, l1_validator_count − TARGET_L1_VALIDATOR_CAPACITY) / L1_FEE_SCALING_CONSTANT) |
These equations implement ACP-77: Reinventing Subnets, which replaced one-time staking with continuous fees. See the L1 Ecosystem subsystem analysis.
Governance Dynamics
| Variable | Law of Motion |
|---|---|
| proposed_acp_count | d(proposed_acp_count)/dt = proposal_rate() − implementation_rate() − stale_rate() |
| activated_acp_count | d(activated_acp_count)/dt = implementation_rate() |
| stale_acp_count | d(stale_acp_count)/dt = stale_rate() |
For governance mechanism analysis, see the Governance subsystem and Mechanism Taxonomy.
Conservation Laws:
- total_staked = validator_staked + delegator_staked
- circulating_supply + total_staked + locked_supply ≤ total_supply
Note on L1 Validators (Post-Etna): Following ACP-77 activation in December 2024, L1 validators are no longer required to validate the Primary Network. This decoupling removed the constraint l1_validator_count ≤ validator_count for modern L1s using the continuous fee model.
2.4 Parameters and Constants
Protocol Constants
| Parameter | Value | Description |
|---|---|---|
| MAX_SUPPLY | 720,000,000 AVAX | Hard cap on total supply |
| MIN_VALIDATOR_STAKE | 2,000 AVAX | Minimum to become validator |
| MAX_VALIDATOR_STAKE | 3,000,000 AVAX | Maximum stake per validator |
| MIN_STAKE_DURATION | 14 days | Minimum staking period |
| MAX_STAKE_DURATION | 365 days | Maximum staking period |
| MIN_CONSUMPTION_RATE | 10% | Reward rate for minimum duration |
| MAX_CONSUMPTION_RATE | 12% | Reward rate for maximum duration |
| MINTING_PERIOD | 365 days | Annualization period |
These parameters are defined in the Avalanche Whitepaper and analyzed in our Economic Taxonomy.
Fee Mechanism Parameters (ACP-103)
| Parameter | Value | Description |
|---|---|---|
| MIN_GAS_PRICE | 1 nAVAX | Floor price per gas unit |
| FEE_ADJUSTMENT_CONSTANT | 2,164,043 | Controls price adjustment speed |
| TARGET_GAS_RATE | 50,000 gas/s | Equilibrium utilization target |
| BANDWIDTH_WEIGHT | 1 | Gas per byte |
| READ_WEIGHT | 1,000 | Gas per state read |
| WRITE_WEIGHT | 1,000 | Gas per state write |
| COMPUTE_WEIGHT | 4 | Gas per microsecond |
Source: ACP-103 specification. The multidimensional approach follows similar principles to Ethereum’s EIP-1559.
L1 Fee Parameters (ACP-77)
| Parameter | Value | Description |
|---|---|---|
| L1_BASE_FEE_RATE | 512 nAVAX/s | Base rate ≈ 1.33 AVAX/month |
| L1_FEE_SCALING_CONSTANT | 1,246,488,515 | Controls fee escalation |
| TARGET_L1_VALIDATOR_CAPACITY | 10,000 | Threshold before fee escalation |
Source: ACP-77 specification.
Behavioral Parameters
| Parameter | Value | Description |
|---|---|---|
| VALIDATOR_RESTAKE_RATE | 70% | Validator reward re-staking |
| DELEGATOR_RESTAKE_RATE | 50% | Delegator reward re-staking |
| AVG_RESTAKE_RATE | 67% | Weighted average |
| COMMISSION_RATE | 2-20% | Validator fee on delegator rewards |
| STAKING_SENSITIVITY | 0.1 | Response strength to APR differential |
| OPPORTUNITY_COST | 5% | External yield benchmark |
For analysis of how external conditions affect these parameters, see Avalanche Economy relative to the Open Economy.
Derived Formulas
Effective Consumption Rate (duration-dependent reward multiplier):
effective_consumption_rate(duration) = MIN_CONSUMPTION_RATE +
    (MAX_CONSUMPTION_RATE - MIN_CONSUMPTION_RATE) ×
    (duration - MIN_STAKE_DURATION) / (MAX_STAKE_DURATION - MIN_STAKE_DURATION)
Reward Distribution (official Avalanche formula):
reward_distribution() = (MAX_SUPPLY - total_supply) ×
    (total_staked / total_supply) ×
    (avg_stake_duration / MINTING_PERIOD) ×
    effective_consumption_rate(avg_stake_duration)
Staking APR:
staking_apr = (reward_distribution() / total_staked) × 365
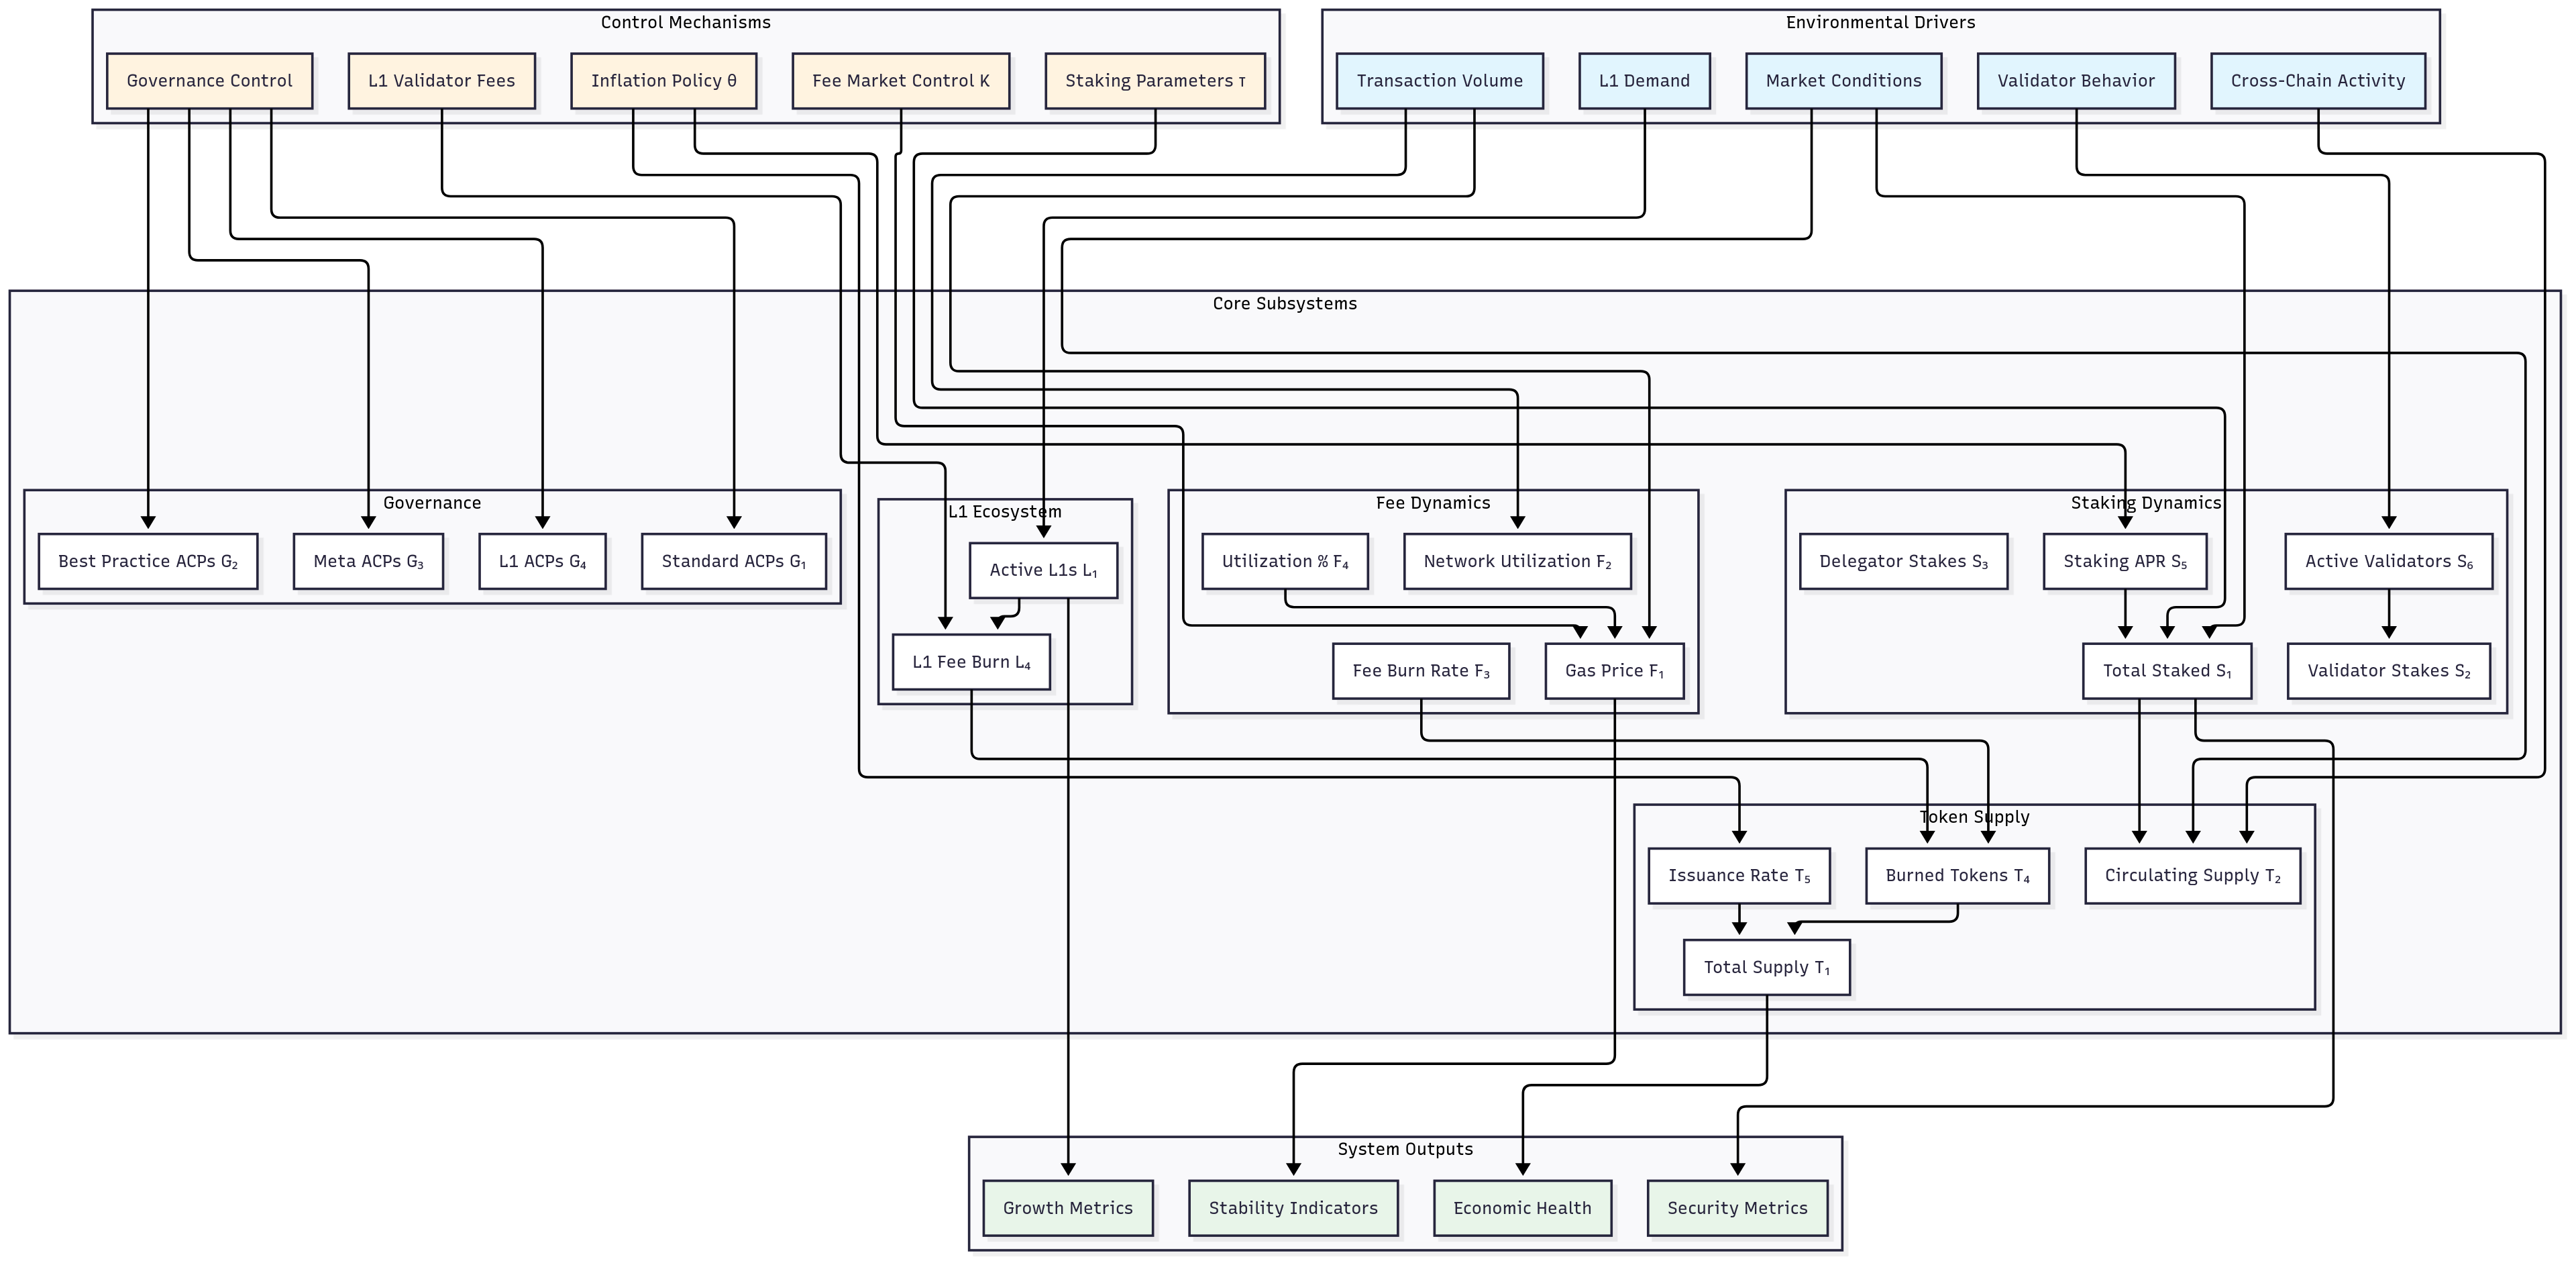
2.5 Subsystem Coupling Matrix
This matrix shows direct dependencies between subsystems. For the full multigraph model, see Subsystem Analysis and MultiGraph.
| Source ↓ / Target → | Staking | Token Supply | Fee Dynamics | L1 Ecosystem | Governance |
|---|---|---|---|---|---|
| Staking | — | issuance_rate ∝ total_staked | staking_apr affected by fees | l1_validator_count ≤ validator_count | Stake-weighted voting |
| Token Supply | staking_apr ∝ (MAX_SUPPLY - total_supply) | — | — | — | — |
| Fee Dynamics | Real APR = staking_apr - fee_impact | cumulative_burned ↑ | — | Combined burn rate | Fee parameter changes |
| L1 Ecosystem | Validator capacity demand | l1_fee_burn_rate | L1 transaction volume | — | L1 track proposals |
| Governance | MIN_VALIDATOR_STAKE, durations | Consumption rates | Fee parameters | L1 fee parameters | — |
Primary Feedback Loops:
| Loop | Type | Mechanism | Key Variables |
|---|---|---|---|
| Staking Dilution | Balancing | staking_apr ↓ as total_staked ↑ | total_staked, staking_apr |
| Fee Burning | Reinforcing | Activity ↑ → Burns ↑ → Scarcity ↑ → Value ↑ | gas_consumed, cumulative_burned |
| Supply Exhaustion | Balancing | issuance_rate → 0 as total_supply → MAX_SUPPLY | total_supply, issuance_rate |
| L1 Growth | Reinforcing | l1_count ↑ → Activity ↑ → Value ↑ → l1_count ↑ | l1_count, l1_fee_burn_rate |
2.6 System Architecture
3. Component Specification
This section classifies system components by their nature and controllability. For the full component taxonomy, see Mechanism Taxonomy.
3.1 Environmental Processes
External forces modeled as exogenous inputs. These drive the system but are not controlled by the protocol.
| Process | Description | Primary Effects |
|---|---|---|
| transaction_volume | Demand for block space | gas_consumed, fee_burn_rate |
| market_conditions | AVAX price, sentiment | staking_inflow(), validator_entry_rate() |
| l1_demand | Developer interest in L1s | l1_creation_rate() |
| macro_rates | External interest rates | OPPORTUNITY_COST benchmark |
| cross_chain_flows | Bridge activity | circulating_supply pressure |
For analysis of external economic forces, see Avalanche Economy relative to the Open Economy.
3.2 Behavioral Processes
Participant responses to system state. These are endogenous but not directly controlled.
| Behavior | Agent | Response Function |
|---|---|---|
| Staking decision | Token holders | staking_inflow() responds to (staking_apr - OPPORTUNITY_COST) |
| Validator participation | Node operators | validator_entry_rate() responds to profitability |
| Delegation choice | Passive stakers | Selects validators by performance and commission |
| L1 development | Builders | l1_creation_rate() responds to L1 economics |
| Fee bidding | Users | Transaction timing based on gas_price |
For detailed participant analysis, see Participant Roles Taxonomy.
3.3 Controlled Mechanisms
Protocol-level controls that can be adjusted through governance.
| Control | Mechanism | Governance Path |
|---|---|---|
| Inflation policy | effective_consumption_rate bounds | Standard Track ACP |
| Fee adjustment | FEE_ADJUSTMENT_CONSTANT, TARGET_GAS_RATE | Standard Track ACP |
| L1 fees | L1_BASE_FEE_RATE, TARGET_L1_VALIDATOR_CAPACITY | Standard Track ACP |
| Stake requirements | MIN_VALIDATOR_STAKE, duration bounds | Standard Track ACP |
| Reward formula | reward_distribution() parameters | Standard Track ACP |
For the full ACP process and recent proposals, see ACP Summaries.
4. System Dynamics
This section explains how each subsystem evolves and specifies the behavioral response functions.
4.1 Staking Dynamics
The staking subsystem governs AVAX flow between liquid and staked states. For subsystem details, see Staking Dynamics.
Behavioral Response Functions:
Staking inflow responds to the APR differential using a bounded sigmoid:
staking_inflow() = STAKING_SENSITIVITY × circulating_supply ×
    max(0, tanh(staking_apr - OPPORTUNITY_COST))
Unstaking outflow increases when opportunity cost exceeds staking returns:
unstaking_outflow() = STAKING_SENSITIVITY × total_staked ×
    max(0, tanh(OPPORTUNITY_COST - staking_apr))
Validator entry depends on expected profitability:
validator_profit = (validator_rewards() / validator_count) - operational_cost
validator_entry_rate() = base_entry × max(0, tanh(validator_profit / threshold))
Validator exit accelerates when profitability becomes negative:
validator_exit_rate() = base_exit × max(0, tanh(-validator_profit / threshold))
Equilibrium Behavior:
At equilibrium, net stake change is zero. The system finds a staking ratio where:
- staking_apr ≈ OPPORTUNITY_COST (adjusted for risk premium)
- Validator profitability covers operational costs
- Target range: 50-60% of circulating_supply staked
Stability: The staking system is self-correcting. Higher staking dilutes staking_apr, reducing incentives and allowing the ratio to stabilize.
4.2 Token Supply Dynamics
The token supply subsystem tracks AVAX creation and destruction. For subsystem details, see Token Supply.
Supply Evolution:
Total supply grows via staking rewards but is hard-capped:
d(total_supply)/dt = issuance_rate    if total_supply < MAX_SUPPLY
d(total_supply)/dt = 0                 if total_supply = MAX_SUPPLY
As total_supply approaches MAX_SUPPLY, the factor (MAX_SUPPLY - total_supply) in reward_distribution() naturally reduces issuance toward zero.
Circulating Supply:
Circulating supply is squeezed between issuance (increasing) and staking (decreasing):
circulating_supply = total_supply - total_staked - locked_supply
Deflationary Crossover:
The network becomes net deflationary when:
fee_burn_rate + l1_fee_burn_rate > issuance_rate
Current state (November 2025): ~1,500 AVAX/day burned vs ~49,000 AVAX/day issued. Crossover requires ~33× increase in fee activity, or equivalent issuance reduction as total_supply approaches MAX_SUPPLY. Note: Burn rates have tripled during 2025, indicating positive momentum toward sustainability.
4.3 Fee Market Dynamics
The fee subsystem implements ACP-103 congestion pricing. For subsystem details, see Fee Dynamics.
Excess Gas Accumulator:
The key insight is that gas_price depends on cumulative excess utilization:
d(excess_gas)/dt = gas_consumed - TARGET_GAS_RATE
When gas_consumed > TARGET_GAS_RATE, excess_gas accumulates, driving prices up. When gas_consumed < TARGET_GAS_RATE, excess_gas drains, and prices fall.
Exponential Price Adjustment:
The exponential mechanism provides:
- Floor guarantee: gas_price ≥ MIN_GAS_PRICE always
- Rapid congestion response: Prices rise exponentially under sustained load
- Smooth decay: Prices return gradually to baseline
This mechanism is similar to EIP-1559 but extended to multiple resource dimensions.
Dynamic Gas Limits (ACP-176): The Octane upgrade (April 2025) introduced validator-driven adjustment of TARGET_GAS_RATE via ACP-176. Block builders signal preferred target, and the network converges where 50% of stake weight wants increase vs. decrease. This enables market-discovered capacity rather than centrally-planned limits.
Multidimensional Gas:
ACP-103 prices four resource dimensions independently:
- Bandwidth: bytes transmitted
- State reads: storage lookups
- State writes: storage modifications
- Compute: execution time
This ensures resource-heavy transactions pay proportionally, preventing resource exhaustion attacks.
4.4 L1 Ecosystem Dynamics
The L1 subsystem tracks application-specific blockchain activity under ACP-77. For subsystem details, see L1 Ecosystem.
L1 Lifecycle Functions:
L1 creation responds to economic viability:
l1_creation_rate() = base_creation × demand_factor × exp(-l1_validator_fee() / fee_threshold)
L1 abandonment increases when fees exceed value:
l1_abandonment_rate() = base_abandonment × max(0, l1_validator_fee() - l1_revenue) / l1_revenue
Continuous Fee Mechanism:
ACP-77 replaces one-time stake with continuous fees:
- Base rate: L1_BASE_FEE_RATE ≈ 1.33 AVAX/month per validator
- Escalation: Fees increase exponentially when l1_validator_count exceeds TARGET_L1_VALIDATOR_CAPACITY
This right-sizes the validator set to actual L1 demand.
Validator Architecture (Post-Etna):
Following ACP-77, L1 validators operate independently of Primary Network validation. Modern L1s define their own validator sets through smart contract-based validator managers, enabling:
- Custom staking requirements (PoA, PoS, or hybrid)
- Reduced hardware requirements (only P-Chain sync needed)
- Full economic sovereignty
Legacy L1s (pre-Etna) still require Primary Network validation.
4.5 Governance Dynamics
The governance subsystem manages protocol evolution through ACPs. For subsystem details, see Governance and ACP Summaries.
Proposal Flow:
Proposed → Implementable → Activated
    ↓
  Stale
Hysteresis Constraints:
To prevent destabilizing oscillations, parameter changes are rate-limited:
- Minimum interval between changes to the same parameter
- Maximum change magnitude per governance cycle
- Cooldown periods after significant changes
These constraints ensure the system has time to equilibrate between adjustments.
5. Equilibrium and Stability Analysis
This section analyzes system equilibria and stability properties. For hypothesis testing approaches, see Economic Hypotheses.
5.1 Staking Equilibrium
At equilibrium, d(total_staked)/dt = 0:
staking_inflow() + AVG_RESTAKE_RATE × reward_distribution() = unstaking_outflow()
This occurs when staking_apr balances against OPPORTUNITY_COST. The equilibrium staking ratio depends on:
- External yield environment (OPPORTUNITY_COST)
- Protocol reward parameters (consumption rates)
- Risk premium demanded by stakers
Target Range: 50-60% of circulating_supply staked
- Below 50%: Security concerns (insufficient economic security)
- Above 60%: Liquidity concerns (insufficient tokens for network utility)
Stability Analysis: The staking system exhibits strong negative feedback. Perturbations self-correct:
- If total_staked increases → staking_apr decreases → staking_inflow() decreases → system returns to equilibrium
5.2 Fee Market Equilibrium
At equilibrium, d(excess_gas)/dt = 0:
gas_consumed = TARGET_GAS_RATE
excess_gas = 0
gas_price = MIN_GAS_PRICE
The fee market is stable for reasonable demand patterns. The exponential mechanism provides strong restoring force:
- Congestion → Higher prices → Reduced demand → Return to target
- Low demand → Lower prices (bounded by MIN_GAS_PRICE) → Increased demand → Return to target
5.3 Supply Equilibrium
Long-term Trajectory:
As total_supply → MAX_SUPPLY:
reward_distribution() → 0
issuance_rate → 0
The system transitions to a purely deflationary regime where:
- d(total_supply)/dt = 0
- d(cumulative_burned)/dt = fee_burn_rate + l1_fee_burn_rate > 0
- circulating_supply gradually decreases
Sustainability Requirement:
For long-term validator incentives post-issuance, fee revenue must cover costs:
(fee_burn_rate + l1_fee_burn_rate) × validator_share ≥ validator_count × operational_cost
5.4 System-Wide Stability Properties
-
Boundedness: All state variables are bounded
- total_supply ≤ MAX_SUPPLY
- total_staked ≤ total_supply
- gas_price ≥ MIN_GAS_PRICE (no upper bound, but demand-limited)
-
Negative Feedback Dominance: Primary loops are balancing
- Staking-APR loop prevents runaway staking
- Fee-demand loop prevents sustained congestion
-
Conservation Laws: Provide consistency constraints
- Token accounting: circulating_supply + total_staked + locked_supply ≤ total_supply
- Stake accounting: total_staked = validator_staked + delegator_staked
-
Governance Hysteresis: Prevents rapid oscillations
- Rate limits on parameter changes
- Minimum intervals between adjustments
6. Performance Indicators
| Category | Indicator | Formula | Target |
|---|---|---|---|
| Security | Staking ratio | total_staked / circulating_supply | 50-60% |
| Security | Validator count | validator_count | >1,000 |
| Security | Stake decentralization | 1 - HHI(validator_stakes) | >0.99 |
| Economic | Net inflation | (issuance_rate - fee_burn_rate - l1_fee_burn_rate) / total_supply | Decreasing |
| Economic | Burn ratio | (fee_burn_rate + l1_fee_burn_rate) / issuance_rate | Increasing toward 1.0 |
| Economic | Validator profitability | validator_rewards() / validator_count - costs | >0 |
| Stability | APR variance | Var(staking_apr) over time | Low |
| Stability | Fee market efficiency | Corr(gas_consumed, gas_price) | High |
| Growth | L1 adoption | d(l1_count)/dt | Positive |
| Growth | Network utilization | gas_consumed / TARGET_GAS_RATE | 0.8-1.2 |
For detailed hypothesis testing on these indicators, see Economic Hypotheses.
7. Insights into the Avalanche Economy
7.1 Security
The validator subsystem achieves security through economic incentives rather than pure altruism. The reward_distribution() mechanism creates wealth-gaining opportunities for honest behavior, while slashing (not modeled here) creates wealth-reducing consequences for faults.
Key insight: The staking_apr must exceed OPPORTUNITY_COST by a sufficient risk premium to attract the target 50-60% staking ratio. If external yields rise significantly, governance may need to adjust consumption rates to maintain security.
Relevant equations: staking_inflow(), validator_entry_rate(), staking_apr calculation
For participant incentive analysis, see Participant Roles Taxonomy.
7.2 Sustainability
Long-term sustainability requires the system to function as issuance_rate approaches zero. The transition path depends on fee activity growth:
Current state (November 2025): Burn ratio ≈ 3% (1,500/49,000 AVAX/day) Required for balance: Burn ratio = 100% Path: ~33× increase in fee activity, OR natural issuance reduction as total_supply → MAX_SUPPLY Positive signal: Burn rate tripled during 2025 (from ~500 to ~1,500 AVAX/day)
The fee_burn_rate + l1_fee_burn_rate must eventually sustain validator economics without inflation subsidies.
Relevant equations: reward_distribution() decay, fee_burn_rate, l1_fee_burn_rate
7.3 Value Creation
The L1 ecosystem serves as the primary value creation engine. Each L1 represents real economic activity that:
- Generates l1_fee_burn_rate (deflationary pressure)
- Demands l1_validator_count (security load)
- Creates utility that attracts users to the broader ecosystem
Key insight: The ACP-77 continuous fee mechanism aligns L1 incentives with network health. L1s that generate value can sustain fees; those that don’t will naturally sunset.
Relevant equations: l1_creation_rate(), l1_fee_burn_rate, l1_validator_fee()
7.4 Stability
The system achieves stability through multiple mechanisms:
-
Automatic stabilizers: The exponential fee mechanism (gas_price equation) and diminishing reward formula (reward_distribution()) provide automatic correction.
-
Governance levers: Parameters like FEE_ADJUSTMENT_CONSTANT, TARGET_GAS_RATE, and consumption rates allow adaptive response to changing conditions.
-
Hysteresis: Rate limits on governance changes prevent overcorrection and oscillation.
Key insight: The coupling matrix (Section 2.5) reveals that Fee Dynamics affects all other subsystems. Fee parameter changes require careful analysis of cross-subsystem impacts.
For external stability factors, see Avalanche Economy relative to the Open Economy.
8. Conclusion
This differential specification provides the mathematical foundation for understanding Avalanche’s economic dynamics. Key findings:
-
Staking equilibrium naturally stabilizes around 50-60% when staking_apr balances external opportunity costs. The tanh-bounded behavioral functions ensure stable convergence.
-
Fee markets self-regulate through the exponential mechanism. The excess_gas accumulator provides memory that smooths price adjustments.
-
Supply trajectory is well-defined: issuance_rate decays as total_supply approaches MAX_SUPPLY, transitioning the network from inflationary to deflationary.
-
L1 economics under ACP-77 create sustainable value capture through continuous fees rather than one-time stakes.
-
Cross-subsystem coupling is manageable. The primary feedback loops are balancing (self-correcting), and governance hysteresis prevents destabilizing oscillations.
The framework enables:
- Simulation: All equations can be implemented in modeling tools (cadCAD, radCAD)
- Prediction: Trajectory analysis under different scenarios
- Optimization: Parameter tuning for specific objectives
- Monitoring: Real-time health assessment via performance indicators
Future work should extend this specification to include:
- Slashing dynamics and their deterrent effects
- Cross-chain bridge flows and their impact on circulating_supply
- Detailed validator operational cost models
- Agent-based simulation validation
For the complete research context, see the Project Overview.
References
[1] Avalanche Platform. (2020). Avalanche Whitepaper.
[2] Avalanche Foundation. ACP-103: Dynamic Fees. Avalanche Community Proposals.
[3] Avalanche Foundation. ACP-77: Reinventing Subnets. Avalanche Community Proposals.
[4] Buterin, V. et al. (2021). EIP-1559: Fee Market Change. Ethereum Improvement Proposals.
[5] BlockScience. cadCAD: Computer-Aided Design for Complex Systems.
[6] CADLabs. Ethereum Economic Model. A cadCAD model for Ethereum’s economic system.
[7] Ogata, K. (2010). Modern Control Engineering. Prentice Hall.
[8] Astrom, K. J., & Murray, R. M. (2021). Feedback Systems: An Introduction for Scientists and Engineers. Princeton University Press.