Avalanche Staking Economics: Phase II Proposal
Project: Parameter Selection Under Uncertainty for Avalanche Staking
Team: Bonding Curve Research Group (BCRG)
Amount: $150,000
Duration: 6 Months
Date: February 4, 2026
Version: 2.3
Executive Summary
Following the successful completion of Phase I—which delivered foundational taxonomies, systems analysis, and a comprehensive differential specification—this proposal outlines Phase II: a focused investigation of the Avalanche staking subsystem using the Parameter Selection Under Uncertainty (PSUU) methodology.
Phase II will produce validated, actionable parameter recommendations specifically for the staking subsystem, enabling the Avalanche Foundation to make data-driven decisions about validator rewards, staking duration, and yield structures.
Staking economics is a top priority for the Foundation. Multiple community-initiated ACPs already address validator and delegation mechanisms, signaling both urgency and opportunity. This work delivers the analytical foundation those governance decisions require.
Key deliverables:
- Flexible simulation framework with pluggable reward mechanisms for evaluating alternative designs
- Calibrated staking model validated against 2024-2025 historical data
- Sensitivity analysis revealing which governance levers most affect staking outcomes
- Collaborative mechanism design support for rapid evaluation of reward function alternatives
- Parameter recommendation report with decision trees and correlation analysis
- Open source model and knowledge transfer workshops
- Analytic support for ACP development regarding staking incentives and parameterization
Part I: Scope
Focus: The Staking Subsystem
Phase II focuses on the staking subsystem, treating other components of the differential specification as environmental context. This narrower scope enables deeper analysis of the mechanisms that matter most:
- Validator staking behavior
- Delegator staking behavior
- Reward mechanics and yield determination
- Duration-dependent incentive structures
Other subsystems from the full differential specification—L1 ecosystem dynamics, fee markets, cross-chain flows—are treated as environmental inputs rather than endogenous components. This abstraction keeps the model tractable while preserving the dynamics most relevant to staking parameter decisions. Fee revenue and L1 adoption rates enter as scenario variables rather than simulated outcomes.
The Core Question
Under what “governance” configurations do Avalanche’s staking incentives sustain validator and delegator participation across bull markets, bear markets, and competing DeFi yields—while maintaining the security guarantees required by a multi-billion dollar network?
Part II: Methodology
The Challenge: Selecting Parameters Under Uncertainty
Governance decisions about staking parameters—yield bounds, duration limits, validator shares—must account for conditions that cannot be known in advance. What external DeFi yields will look like in six months, whether the market will be bullish or bearish, how network adoption will evolve: these factors affect whether a given parameter configuration succeeds or fails, yet they lie outside the protocol’s control.
Traditional parameter selection either ignores this uncertainty (picking values that work for one assumed future) or handles it informally (expert judgment). PSUU provides a systematic alternative: explore how parameter choices perform across many possible futures, then identify configurations that succeed robustly.
Parameter Selection Under Uncertainty (PSUU)
PSUU, developed by Block Science, is a computational methodology that maps the relationship between governance decisions and system outcomes across environmental scenarios. Successfully applied to Subspace Network tokenomics, it produces actionable recommendations backed by simulation evidence.
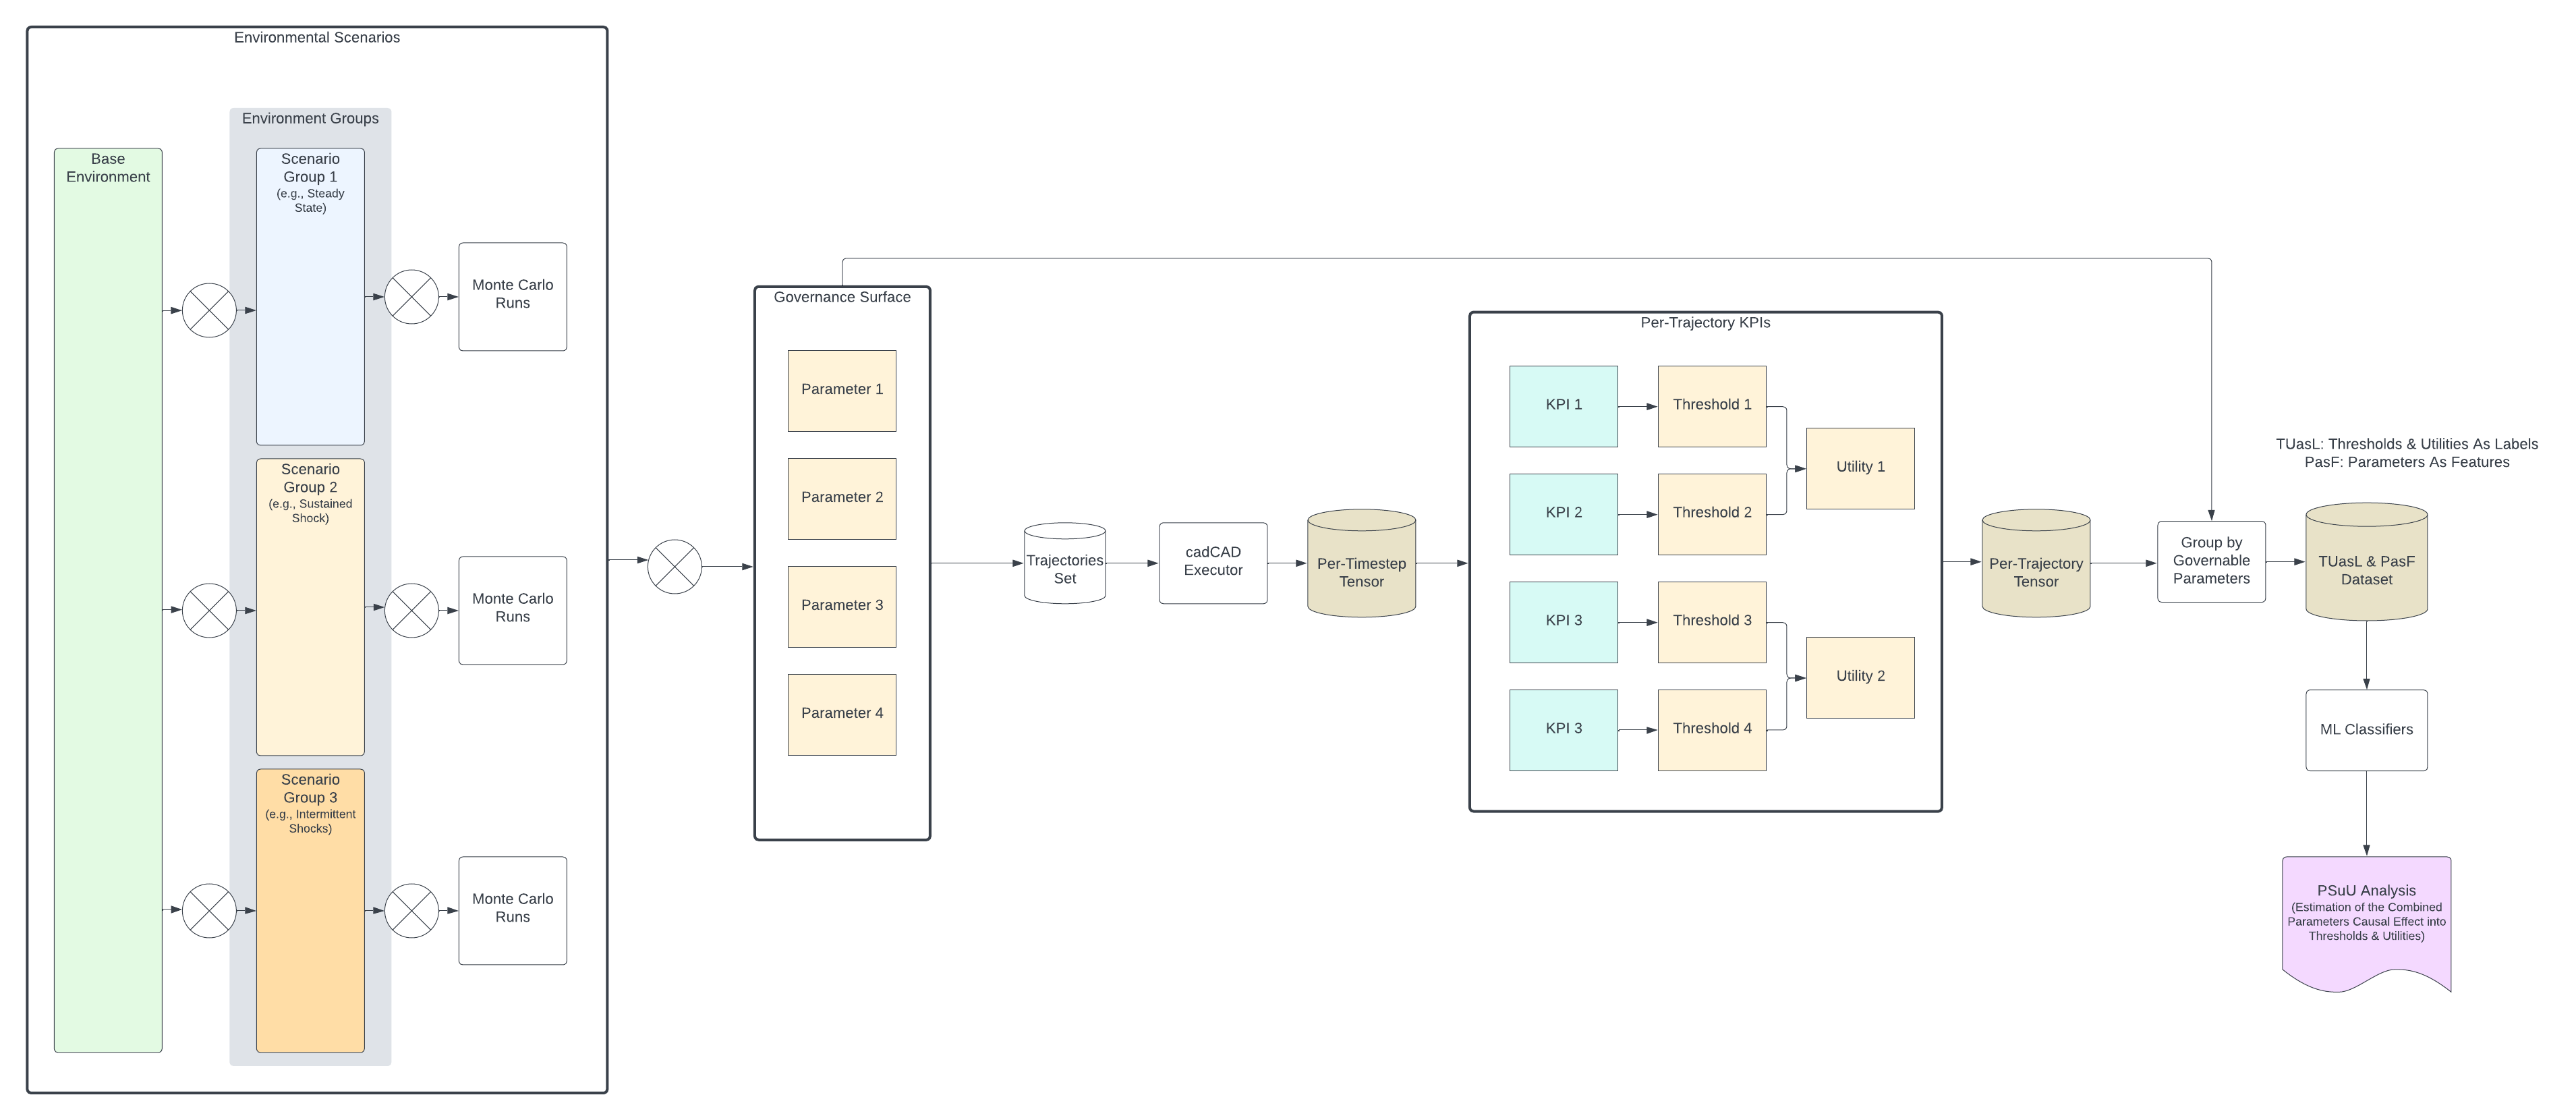 Fig 1: Complete PSUU data pipeline. Left: Environmental scenarios (Scenario Groups 1-3) combined with Monte Carlo runs. Center: Governance parameters feed into the cadCAD simulation executor, producing per-timestep trajectories. Right: KPIs are computed per trajectory, converted to binary utilities via thresholds, grouped by controllable parameters, and passed to ML classifiers for analysis. The output identifies which parameter configurations achieve goals across scenario conditions.
The Trajectory Tensor
The core data structure is a 4-dimensional tensor of simulation results:
The trajectory tensor is the central data structure of PSUU—it stores every simulation result indexed by four coordinates: parameter configuration (c), environmental scenario (s), Monte Carlo run (r), and KPI (k). This tensor is the complete record of how the system behaves across all combinations, and all subsequent analysis derives from it.
| Dimension | Symbol | Description | Example Size |
|---|---|---|---|
| Controllable parameters | Governance configurations | 500 combinations | |
| Scenarios | Environmental conditions | 20 scenarios | |
| Monte Carlo runs | Stochastic variation | 5 runs per combination | |
| KPIs | Success metrics | 7 indicators |
For Phase II, this yields approximately 50,000 trajectories (500 × 20 × 5), each producing 7 KPI measurements—350,000 data points mapping the governance-to-outcome relationship.
How PSUU Works
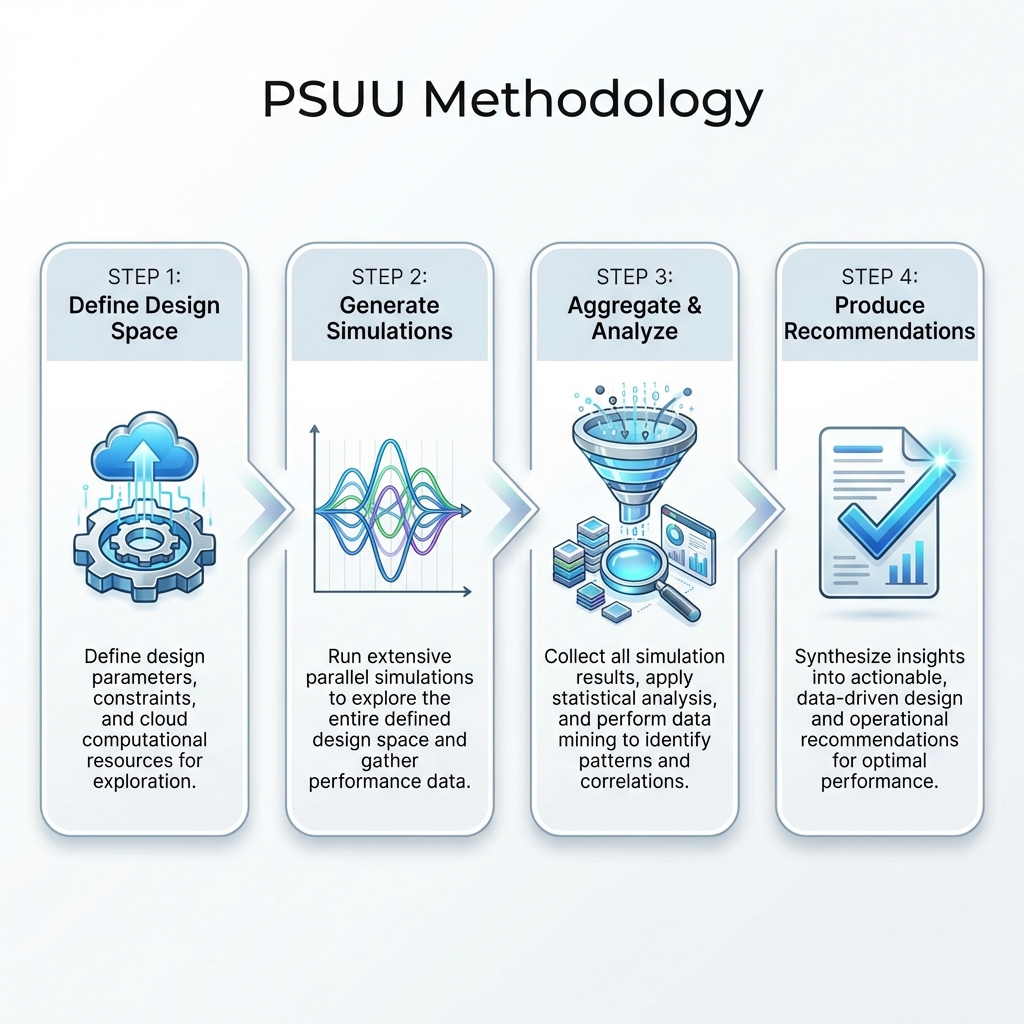 Fig 2: The four-step PSUU workflow. Step 1 defines controllable parameters, environmental scenarios, and cloud compute resources. Step 2 runs parallel simulations across the full design space. Step 3 aggregates results, applies statistical analysis, and identifies patterns through data mining. Step 4 synthesizes findings into actionable recommendations for governance decisions.
Step 1: Define the Design Space
The design space bounds the analysis. This step specifies what can be controlled (governance parameters with exploration ranges), what cannot be controlled (environmental scenarios), and what constitutes success (KPIs with thresholds).
Step 2: Generate Simulations
Simulation generates the raw data for analysis. The calibrated model runs across the Cartesian product of parameter combinations and scenarios, with multiple Monte Carlo runs per combination to capture stochastic variation in behavioral responses.
Step 3: Aggregate and Analyze
Analysis transforms simulation data into actionable patterns. For each trajectory, compute KPIs and convert continuous values to binary utility outcomes (threshold met = 1, not met = 0). Machine learning—decision trees, correlation analysis—identifies which parameters most influence which outcomes.
Step 4: Produce Recommendations
The final step translates analysis into governance guidance. Parameter recommendations are output at three levels of specificity:
- Point estimates: Single best-guess values for each parameter
- Per-goal ranges: Parameter bounds optimized for individual goals (G1, G2, or G3)
- Global ranges: Parameter bounds that satisfy all goals simultaneously
Example Output: Decision Tree
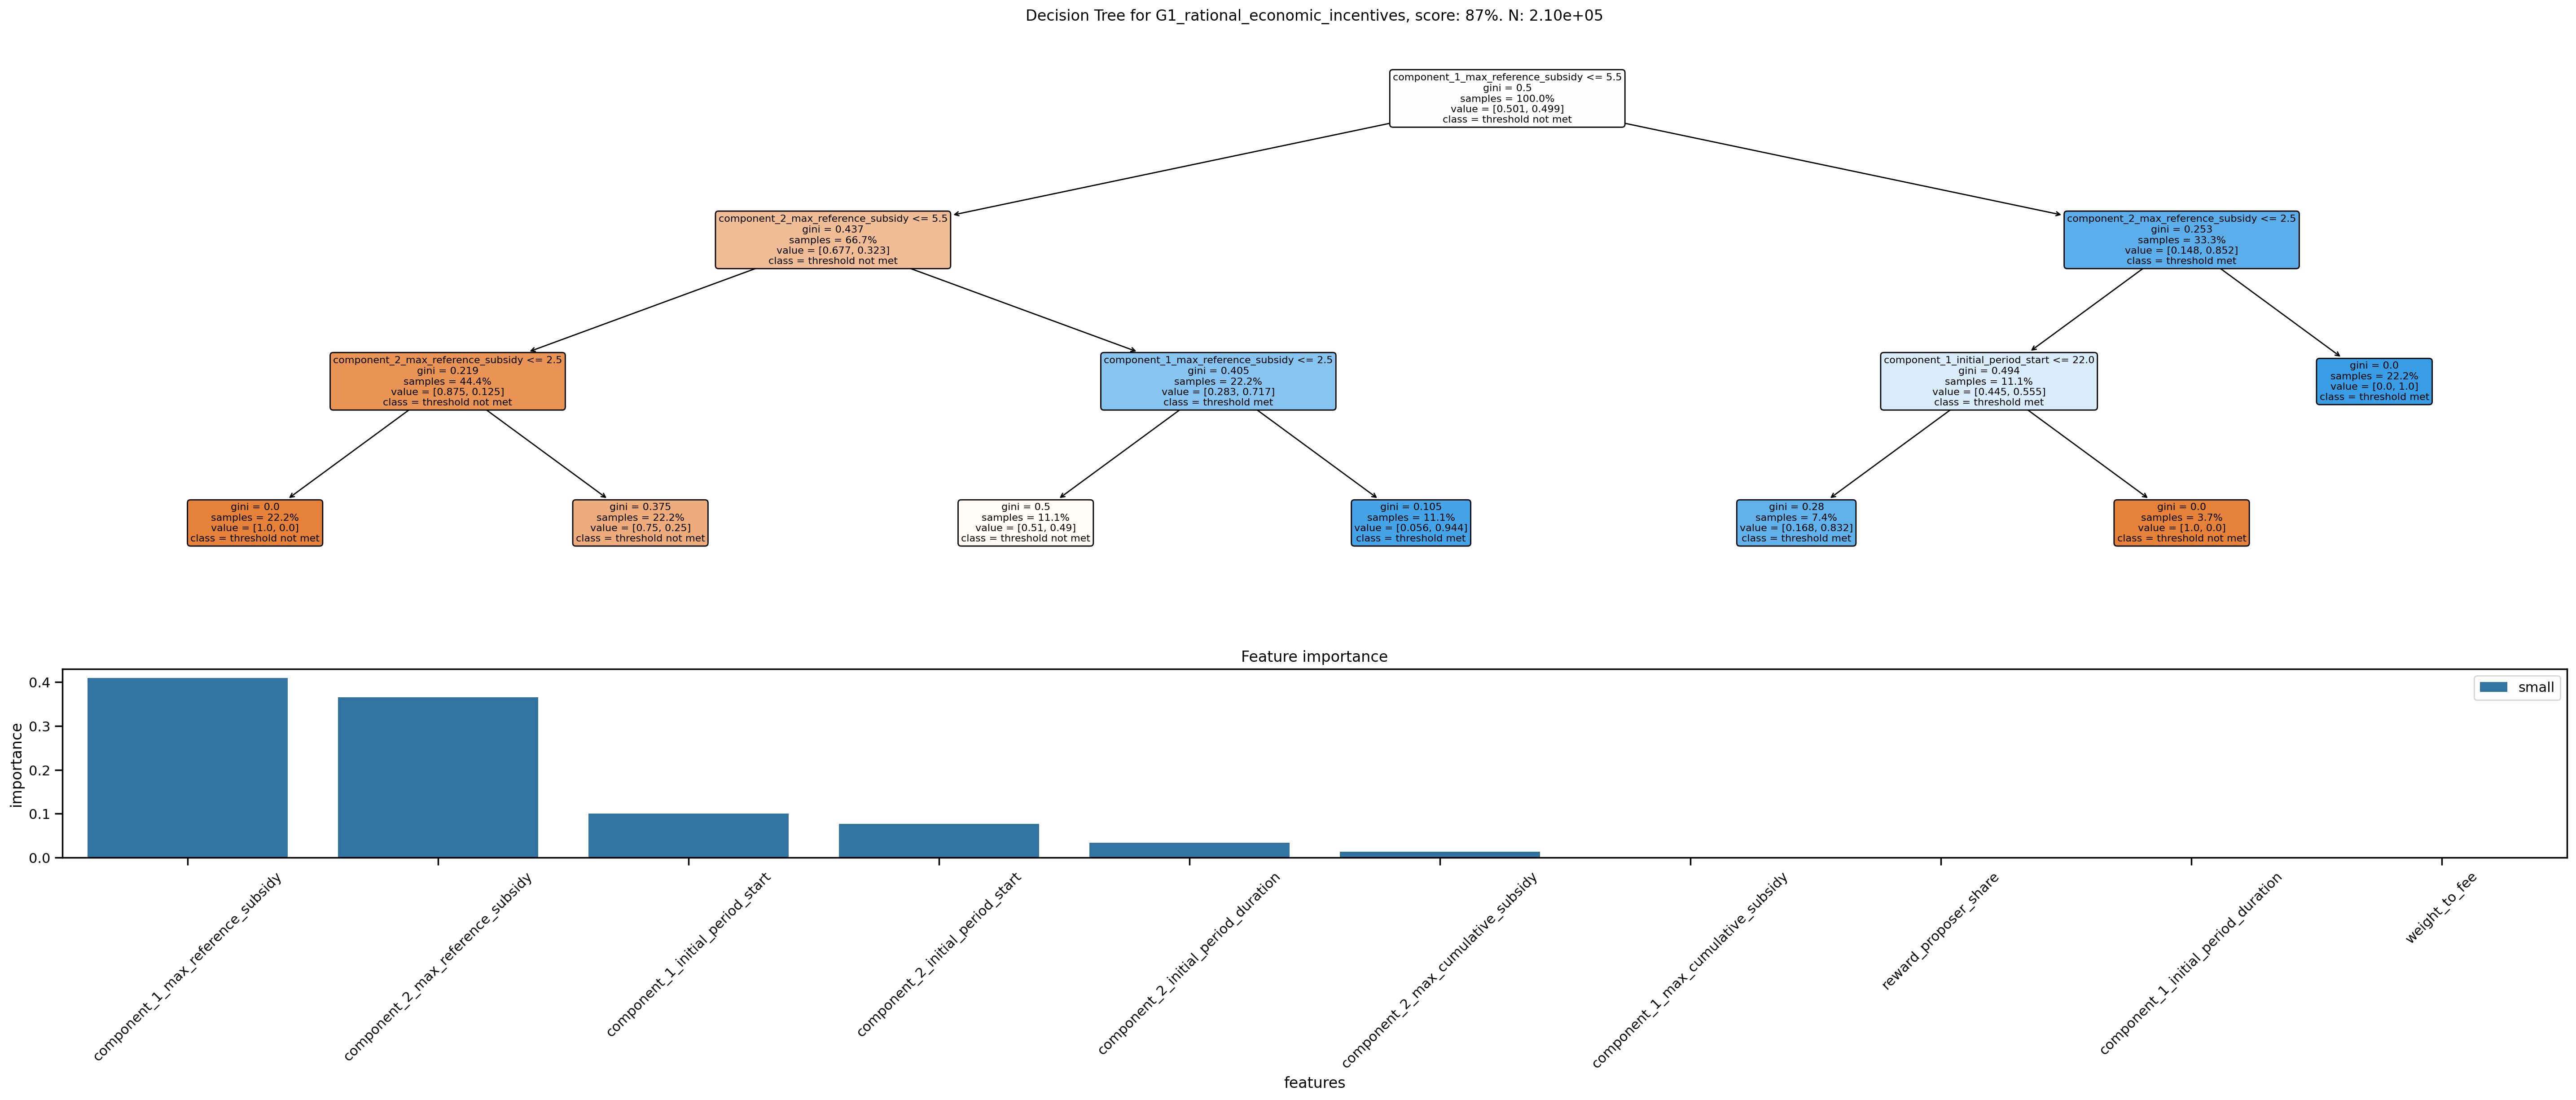 Fig 3: Decision tree for goal G1 (rational economic incentives), achieving 87% classification accuracy across 210,000 simulation trajectories. The tree structure (top) shows decision splits: orange nodes indicate parameter ranges that fail the goal threshold; blue nodes indicate success. The feature importance chart (bottom) ranks parameters by their influence on goal achievement—taller bars indicate parameters whose values most determine whether the goal is met.
Example Output: Parameter Influence
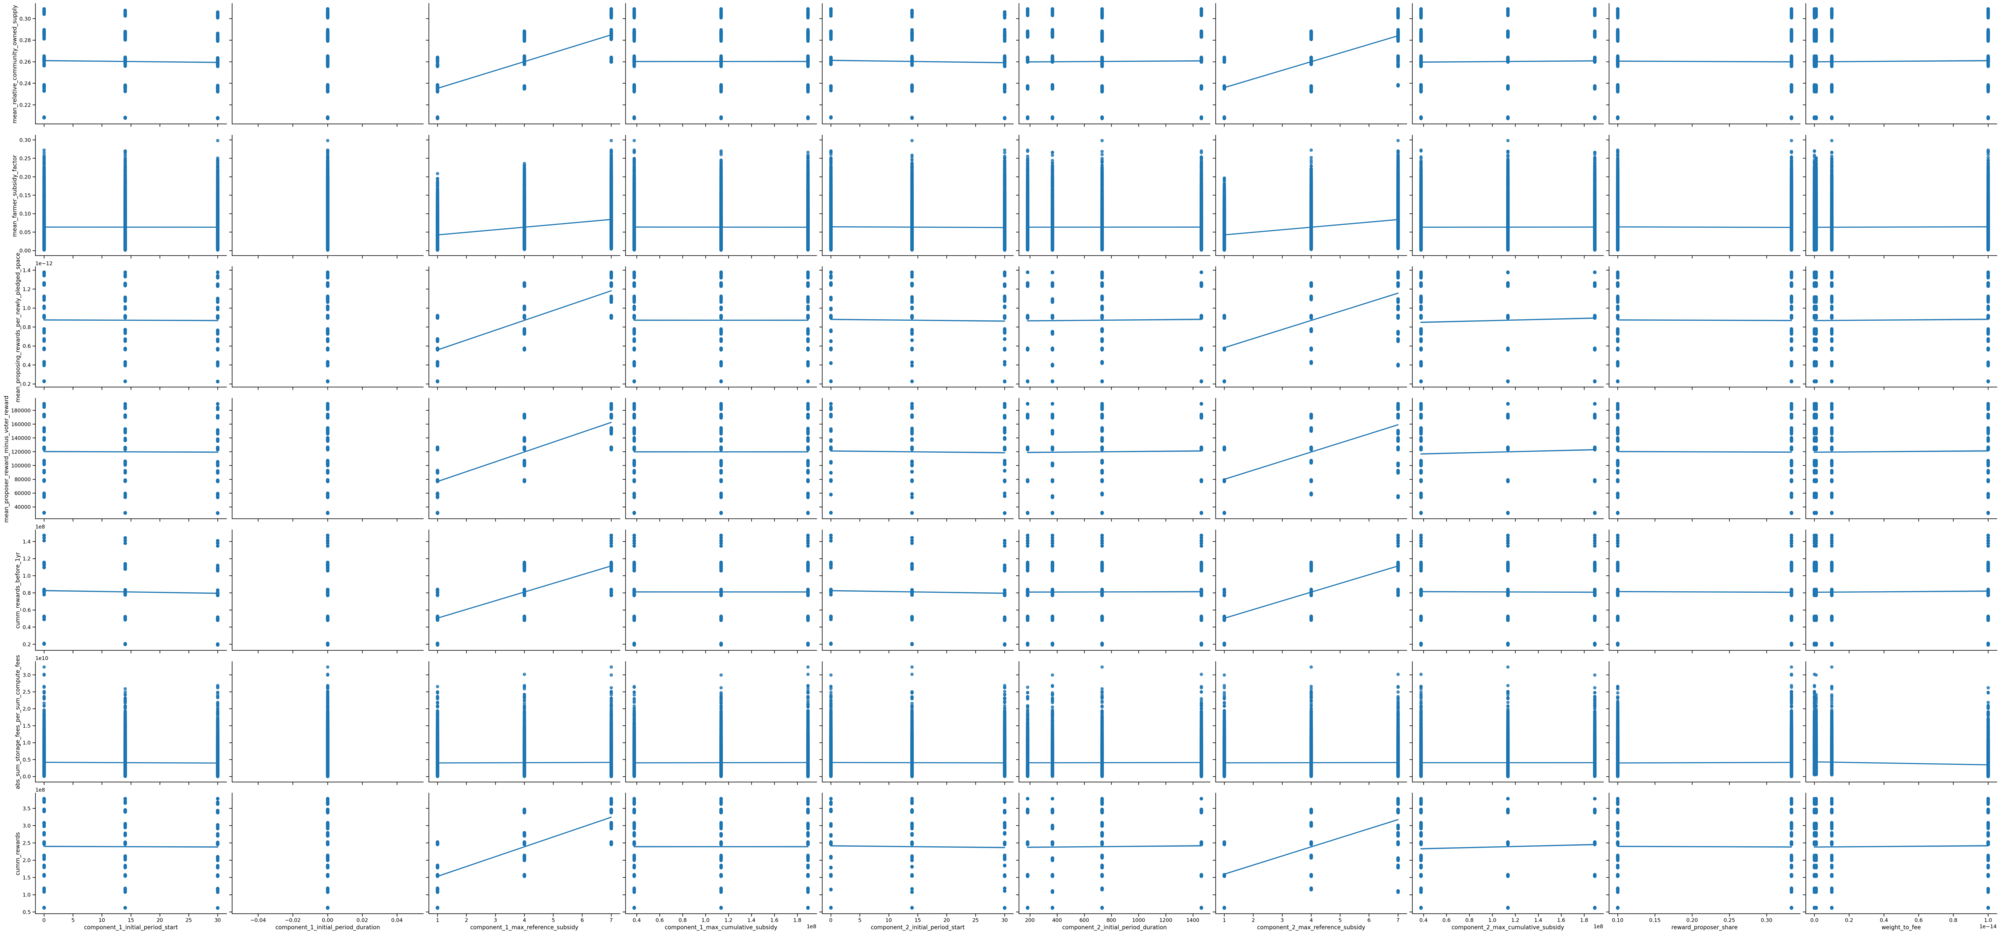 Fig 4: Parameter-KPI influence matrix from prior PSUU engagement. Each cell shows how varying a parameter (columns) affects a KPI (rows) across all simulation runs. Upward-sloping scatter indicates positive correlation—increasing the parameter improves the KPI. Downward slopes indicate negative correlation. Flat or scattered patterns indicate weak influence. This visualization enables rapid identification of which governance levers most affect which outcomes, and whether effects are monotonic or exhibit threshold behavior.
Part III: The Design Space—Parameters and Mechanisms
The design space below is illustrative, drawn from preliminary discussions. The actual parameters, ranges, scenarios, and KPIs will be refined collaboratively with the Avalanche team and validated against real data during Milestone 1. What follows is a starting point, not a commitment.
Controllable Parameters (Governance Surface)
These are policy levers the Avalanche Foundation can adjust. The current reward function is defined as:
The reward function defines how staking rewards are calculated. A staker’s reward equals the remaining reward pool (maximum minus already distributed), scaled by their share of the total supply that’s staked, prorated by their stake duration as a fraction of a year, and multiplied by a duration-dependent yield factor C.
The consumption rate function C determines the yield multiplier based on lockup duration. It starts at the minimum yield for shortest lockups and scales linearly up to maximum yield for longest lockups—stake for the minimum duration, receive the minimum APR; stake for the maximum duration, receive the maximum APR; durations in between interpolate proportionally.
| Symbol | Type | Description | Current | Range |
|---|---|---|---|---|
| Constant | Maximum reward pool | 720M AVAX | Fixed | |
| State | Rewards already distributed | ~410M AVAX | 0 – | |
| State | Total AVAX staked network-wide | ~260M AVAX | 0 – | |
| State | Total AVAX supply | ~450M AVAX | Grows with issuance | |
| Constant | One year (normalization) | 1 year | Fixed | |
| Governance | Minimum lockup period | 2 weeks | 1 week – 3 months | |
| Governance | Maximum lockup period | 1 year | 6 months – 2 years | |
| Governance | APR at minimum duration | ~6% | 4% – 8% | |
| Governance | APR at maximum duration | ~8% | 6% – 12% | |
| Governance | Validator share (rest to delegators) | ~80% | 60% – 90% | |
| Derived | Lockup period per position | Varies | – | |
| Derived | Duration-dependent yield multiplier | Varies | – |
Mechanism Design Space
The current reward function is one design among many possible. Beyond parameter sweeps on the existing formula, Phase II accommodates alternative mechanism designs. The simulation framework treats the reward function as a pluggable component, enabling evaluation of fundamentally different incentive structures—piecewise, state-dependent, node-age-weighted—against identical KPIs and scenarios.
Why this matters: The Avalanche Foundation is actively collaborating with external teams on mechanism ideation—surveying possibilities like node-age-weighted rewards, activity-based multipliers, or duration curve alternatives. BCRG’s contribution complements this ideation work by providing the analytical engine to evaluate proposed mechanisms, rather than generating designs independently.
Framework capabilities:
| Capability | Description |
|---|---|
| Pluggable reward functions | Swap alternative reward formulas (linear, piecewise, state-dependent) without model restructuring |
| Mechanism comparison | Test multiple reward structures against identical scenarios and KPIs |
| Collaborative iteration | Rapidly incorporate mechanisms from external ideation into the simulation pipeline |
| Case study methodology | Prior engagements demonstrate this approach: evaluating multiple issuance functions, subsidy schedules, and fee distribution mechanisms within a unified analytical framework |
The design space tables below represent the current protocol configuration—the starting point for exploration. The framework supports extension to mechanisms that may not exist in the protocol today.
Environmental Scenarios (External Uncertainty)
Staking economics operates within a broader environment the protocol cannot control: competing yields rise and fall, market sentiment shifts, network adoption varies. The model must be robust across these conditions:
| Scenario | Description | Values |
|---|---|---|
EXTERNAL_YIELD | Competing DeFi/TradFi yields | 3%, 5%, 7%, 10% |
MARKET_CONDITION | Crypto market sentiment | Bull, Neutral, Bear |
NETWORK_GROWTH | L1 adoption rate | Low, Medium, High |
Scenario Groups:
The PSUU methodology organizes environmental uncertainty into scenario groups, each serving a distinct analytical purpose:
| Group | Behavioral Pattern | Purpose |
|---|---|---|
| Baseline | Expected conditions with low variance | Calibration target and central forecast |
| High Volatility | Wide variance in external yields and market conditions | Stress testing parameter robustness |
| Shock Events | Sudden, temporary disruptions (flash crash, yield spike) | Resilience and recovery analysis |
| Sustained Stress | Prolonged adverse conditions (bear market + DeFi yield surge) | Worst-case planning and failure mode identification |
Behavioral Dynamics (Response Functions Calibrated from Data)
A key methodological advancement: behavioral parameters evolve endogenously as state variables rather than remaining fixed constants. When APR rises relative to external yields, staking inflows increase; the model captures this response dynamically.
Core Behavioral Parameters:
| Parameter | Value (Spec) | Phase I Concept | Phase II Treatment |
|---|---|---|---|
STAKING_SENSITIVITY | 0.1 | Fixed Stake Rate | State Variable: f(APR differential) |
OPPORTUNITY_COST | 5% | Fixed Unstake Rate | State Variable: f(External Yields) |
AVG_RESTAKE_RATE | 67% | Fixed Restake Rate | State Variable: f(Compounding Incentive) |
COMMISSION_RATE | 2-20% | N/A | Variable distribution parameter |
Response Function Form:
Staking flows respond to the spread between native APR and external opportunity cost. When Avalanche staking yields exceed what participants could earn elsewhere (DeFi, TradFi alternatives), inflows increase; when external yields dominate, outflows accelerate. The response function captures this bounded rationality—participants don’t react instantaneously or perfectly, but they do respond directionally to incentive differentials.
Note: The
tanhfunction below is an illustrative reference implementation of bounded rationality. We are not biased toward this specific form; Phase II will empirically calibrate the optimal response function (e.g., logistic, piecewise linear) against historical data.
The flow equation models how stakers respond to incentive differentials. Net staking flow depends on the spread between what Avalanche pays (APR) and what stakers could earn elsewhere (opportunity cost). When APR exceeds opportunity cost, the tanh function produces a positive value and stake flows in; the larger the spread, the faster the flow. The tanh bounds the response to prevent infinite flows, max(0, …) isolates inflows from outflows, and SENSITIVITY controls how reactive participants are to these differentials.
Calibration approach:
Behavioral calibration grounds the model in observed data. The process fits response function parameters to historical stake/unstake patterns, validates the fit against held-out data, then wraps uncertainty bounds around those parameters for PSUU exploration:
- Ingest Avalanche-provided historical data (2024-2025)
- Fit the response functions (f) to observed stake/unstake patterns—these functions define how behavioral parameters evolve during simulation
- Validate fitted functions against held-out data
- Apply uncertainty bounds to function parameters for PSUU exploration
Key Performance Indicators
Key Performance Indicators (KPIs) define what “success” means for each simulation trajectory. A parameter configuration succeeds if it achieves acceptable KPI values; it fails if any KPI crosses a critical threshold. Aligned with the Differential Specification, we categorize these indicators into three domains—Security, Economics, and Stability:
| Category | Indicator | Target Direction | Description |
|---|---|---|---|
| Security | STAKING_RATIO | 50-60% | Optimal range for economic security vs. liquidity. |
| Security | VALIDATOR_COUNT | >1,000 | Maintaining sufficient decentralization. |
| Security | DECENTRALIZATION | High (1-HHI) | Preventing stake concentration. |
| Economic | NET_INFLATION | Decreasing | Path toward deflationary crossover (burn > issuance). |
| Economic | VAL_PROFITABILITY | >0 (Sustainable) | Rewards + Fees must cover operational costs. |
| Stability | APR_VOLATILITY | Low Variance | Preventing erratic yield fluctuations. |
| Stability | STAKING_VOLATILITY | Low Variance | Preventing rapid mass unstaking events. |
Goal Hierarchy
KPIs measure specific outcomes; strategic goals group related KPIs under broader objectives. The PSUU analysis organizes indicators under three goals, enabling both per-goal and multi-objective optimization:
| Goal | Intent | KPIs |
|---|---|---|
| G1: Incentive Alignment | Rewards proportional to contribution | VAL_PROFITABILITY, APR_VOLATILITY |
| G2: Participation Distribution | Stake spread across validators | DECENTRALIZATION, VALIDATOR_COUNT |
| G3: Network Security | Maintain security guarantees | STAKING_RATIO, STAKING_VOLATILITY, NET_INFLATION |
The analysis produces parameter recommendations optimized for each goal individually, plus globally balanced recommendations that satisfy all three goals simultaneously. This multi-objective approach reveals trade-offs: parameter configurations that maximize G1 may underperform on G3, informing governance decisions about acceptable trade-off boundaries.
Part IV: Model Validation
Model validity determines recommendation validity. The validation protocol compares simulated trajectories against observed 2024-2025 data to confirm the behavioral calibration captures actual staker response patterns.
Goodness-of-Fit Protocol
Approach:
Validation follows a backtesting protocol: initialize the model at a known historical state, simulate forward, and compare trajectories against what actually occurred. Systematic divergence indicates miscalibration; close tracking confirms the model captures real staker behavior.
- Initialize model with actual state variables from January 2025
- Run simulation forward through December 2025
- Compare simulated trajectories to observed historical values
- Compute goodness-of-fit metrics
Metrics:
Multiple metrics assess fit quality, capturing different aspects of model-reality alignment. Correlation measures overall trend fidelity; RMSE quantifies magnitude of deviations; duration matching ensures the model captures when changes occur, not just their final values.
| Metric | Description | Target |
|---|---|---|
| Trajectory correlation | Pearson r between simulated and actual | > 0.90 |
| RMSE (staking ratio) | Root mean squared error | < 2 percentage points |
| Direction accuracy | % of time trends match | > 85% |
| Duration matching | Temporal dynamics alignment—model captures when state changes occur, not just final values | Phase alignment within ±7 days |
| Turning point detection | Captures major inflections | Qualitative assessment |
If validation fails: Iterate on behavioral parameter calibration until acceptable fit is achieved. This ensures the model’s sensitivity analysis reflects reality, not artifacts.
Part V: Milestones & Deliverables
The work proceeds through three milestones, each with a distinct focus and gated success criterion. Milestone 1 establishes the analytical foundation; Milestone 2 executes the core PSUU analysis; Milestone 3 synthesizes findings into actionable deliverables. Payment is tied to milestone completion, ensuring accountability at each stage.
Milestone 1: Foundation (Months 1-2)
Focus: Data ingestion, model definition, behavioral calibration
Deliverables:
| ID | Deliverable | Description |
|---|---|---|
| 1.1 | Data Ingestion | Ingest Avalanche-provided historical data (validator/delegator flows, rewards, durations) |
| 1.2 | Data Manifest | Documentation of sources, transformations, quality metrics |
| 1.3 | Staking Model Spec | Simplified model focused on staking subsystem with behavioral state variables |
| 1.4 | Behavioral Calibration | Fitted response functions for stake/unstake/restake with confidence intervals |
| 1.5 | Preliminary Validation | Initial goodness-of-fit assessment against 2024-2025 data |
Success Criterion: Preliminary Validation Report delivered and approved by Avalanche team
Budget: $40,000
Milestone 2: Simulation & Analysis (Months 3-4)
Focus: PSUU implementation, Monte Carlo sweeps, sensitivity analysis
Deliverables:
| ID | Deliverable | Description |
|---|---|---|
| 2.1 | PSUU Infrastructure | Full parameter sweep pipeline with cloud compute |
| 2.2 | Simulation Execution | 50,000+ trajectories across governance × environment space |
| 2.3 | KPI Computation | Automated computation of all KPIs per trajectory |
| 2.4 | Validation Confirmation | Final goodness-of-fit achieving >90% correlation |
| 2.5 | Sensitivity Analysis | Decision trees and correlation matrices for all KPIs |
| 2.6 | Risk Surface Map | Parameter regions where staking incentives fail |
| 2.7 | Workshop #1 | Model walkthrough and preliminary findings review |
| 2.8 | Collaborative Mechanism Design | Support for evaluating alternative reward mechanisms proposed by Avalanche or external teams |
Deliverable 2.8 Detail: The Foundation is exploring alternative reward mechanisms with external collaborators—node-age weighting, activity multipliers, duration-curve alternatives. BCRG provides the analytical engine for rigorous evaluation of these proposals. The deliverable includes:
- Interface specification for defining new mechanisms as pluggable components—swap for alternative functional forms (piecewise, state-dependent, node-age-weighted) without restructuring the simulation
- Evaluation turnaround of under 5 business days per mechanism proposal
- Output format: Correlation tables showing parameter-to-KPI relationships, confidence ratings, and recommendation tiers (point estimate, per-goal range, or global range)
This workflow follows the methodology demonstrated in the Subspace Issuance Function Economic Report, where Block Science evaluated multiple issuance function proposals—from hyperbolic dynamic issuance to component-based piecewise subsidies—within a unified analytical framework. Each mechanism was tested against identical scenarios and KPIs, enabling direct comparison and informed selection.
This structure ensures BCRG’s analytical work complements—rather than duplicates—the Foundation’s parallel mechanism ideation efforts. External collaborators generate creative proposals; BCRG provides the rigorous evaluation framework that tests those proposals against realistic scenarios and quantifiable success criteria.
Success Criterion: Sensitivity Analysis Report delivered covering all key parameters
Budget: $60,000
Milestone 3: Delivery & Transfer (Months 5-6)
Focus: Recommendations, documentation, knowledge transfer
Deliverables:
| ID | Deliverable | Description |
|---|---|---|
| 3.1 | Parameter Recommendation Report | Actionable guidance with decision framework |
| 3.2 | Scenario Playbook | ”If X market condition, then Y parameter adjustment” |
| 3.3 | Open Source Release | Full model code with documentation |
| 3.4 | Workshop #2 | How to run scenarios and interpret results |
Success Criterion: Final Parameter Report delivered and Code Repository transferred
Budget: $50,000
Part VI: Budget Summary
| Category | Item | Amount |
|---|---|---|
| Milestone 1 | Foundation | $40,000 |
| Milestone 2 | Simulation & Analysis | $60,000 |
| Milestone 3 | Delivery & Transfer | $50,000 |
| TOTAL | $150,000 |
Budget Breakdown by Function
| Function | Amount | Notes |
|---|---|---|
| Principal Researcher | $90,000 | Model architecture, analysis, synthesis |
| Data Engineering | $38,000 | Data pipeline, simulation infrastructure |
| Compute | $2,000 | Cloud resources for Monte Carlo sweeps |
| Operations | $10,000 | Coordination, documentation, workshops |
| Buffer | $10,000 | Unforeseen complexity |
The budget reflects two efficiencies: focused scope on the staking subsystem (rather than the full economic system), and existing infrastructure from Phase I. The differential specification, simulation framework architecture, and team relationships are already established—Phase II builds on that foundation rather than starting from scratch.
Part VII: Timeline
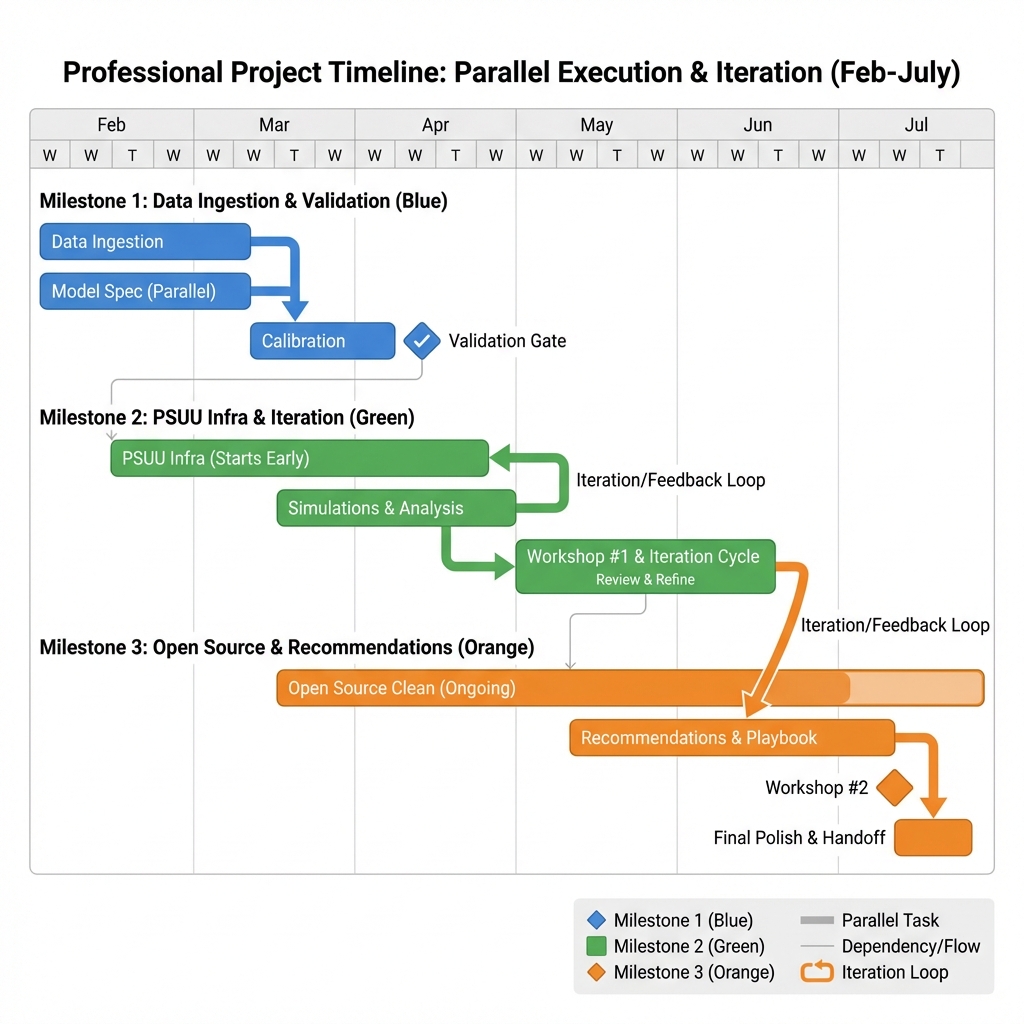 Fig 5: Six-month project timeline (February–July) showing three milestones with parallel work streams. Milestone 1 (blue): Data ingestion and model specification run in parallel, converging at the calibration validation gate. Milestone 2 (green): PSUU infrastructure starts early; simulations and analysis feed into Workshop #1, which initiates an iteration/feedback loop for refinement. Milestone 3 (orange): Open source cleanup runs continuously; recommendations and playbook development lead to Workshop #2 and final handoff. Arrows indicate dependencies; loops indicate iterative cycles where Avalanche feedback refines outputs.
Part VIII: Team
| Role | Name | Responsibility |
|---|---|---|
| Project Lead | Hash Nabir | Stakeholder coordination, milestone management |
| Principal Researcher | Shawn Anderson | Model architecture, PSUU implementation, analysis |
| Data Engineer | Rex | Data analysis, simulation infrastructure |
| Domain Advisor | Jeff Emmett | Token economics, mechanism design, model review |
| Operations Support | Jessica Zartler | Coordination, documentation, publishing |
Part IX: Success Criteria
Phase II succeeds when the Avalanche team has both the analysis and the tools to make data-driven staking parameter decisions. The criteria below make that definition concrete and measurable.
| Criterion | Measurement | Target |
|---|---|---|
| Model validity | Goodness-of-fit vs. historical data | >90% correlation |
| Analysis coverage | KPIs with significant sensitivity results | All defined KPIs |
| Recommendation clarity | Actionable parameter ranges delivered | Yes |
| Knowledge transfer | Avalanche team can run scenarios independently | Verified in workshop |
| Code quality | Open source, documented, reproducible | GitHub release |
Appendix A: Phase III Horizon
Beyond Phase II, opportunities exist for continued collaboration:
- ACP Advisory: Support community proposal development with simulation-backed analysis
- Ongoing Monitoring: Periodic model updates as network evolves
- Extended Scope: Apply PSUU to other subsystems (fee markets, L1 incentives)
These possibilities represent natural extensions of the Phase II framework. The simulation infrastructure, validation methodology, and collaborative workflows established during this engagement create a foundation for ongoing analytical support. Specific scope and terms can be defined after Phase II completion based on Foundation priorities and emerging network needs.
Appendix B: Reference Materials
The references below document the methodological foundations, prior case studies, and Phase I deliverables that this proposal builds upon. Readers seeking deeper understanding of PSUU mechanics or historical precedent can consult these sources directly.
Phase I Research (BCRG)
- Avalanche Economic Research Portal — Foundational taxonomies, systems analysis, and ACP summaries
- Differential Specification — Mathematical framework defining , reward distribution, and behavioral dynamics
PSUU Methodology (Block Science)
- How to Perform Parameter Selection Under Uncertainty — Methodological foundation for the PSUU approach
- PSUU Work Plan Methodology — Trajectory tensor structures (: Controllable × Scenarios × Monte Carlo × KPIs), goal-utility mapping, and ML analysis pipeline
- Parameter Selection Report — Example deliverable format with correlation/confidence tables and recommendation tiers
Case Studies
- Issuance Function Economic Report — Complete mechanism design workflow: problem statement → proposal iteration → final design → parameter selection. Demonstrates evaluation of multiple reward function candidates within unified framework.
- Subspace Digital Twin Repository — Production-scale PSUU implementation: 200K+ trajectories, 9 controllable parameters, 7 KPIs
Theoretical Foundations
- Voshmgir, S. & Zargham, M. (2020). Foundations of Cryptoeconomic Systems — Theoretical grounding for token system analysis
Proposal prepared by Bonding Curve Research Group
February 4, 2026